The Ultimate Guide to Outbound Call Center Metrics in 2023

- January 29, 2023
Call center metrics are essential tools that help businesses measure the performance and efficiency of their customer service operations.
By tracking key performance indicators (KPIs), call centers can identify areas for improvement, set goals, and optimize their processes to serve their customers better.
This article will discuss the most critical outbound call center metrics, how to track them, and how to use them to drive success in your business.
Now, let's dive into the top call center metrics businesses should track.
But first.
Why should a call center track metrics
Working in a call center without a set method of tracking your metrics is like crossing a busy road with a blindfold.
Agents at call centers make hundreds of outbound calls daily when making sales cold calling, setting appointments, or for telemarketing purposes.
This provides a large amount of data that tells a lot about different business processes. The data not only comes in handy for the management team when making decisions.
Sales agents also get insights on boosting customer service and making customer interactions more valuable.
Operation managers also need the data to manage their workforce and make their agents productive.
Understanding these metrics makes it easy to streamline the call center's operations, which boosts productivity.
Default call center metrics
Default call center metrics are simple data that show the effectiveness of your sales agents.
They include:
- Total time - This is the overall time your call center agents have spent working on leads.
- Average time per lead - The average time an agent spends working on leads. To calculate it, take the time spent on leads in minutes divided by the number of leads.
- Net conversion - The number of leads won after successful calls.
- Leads called - The number of unique leads called over a specified time frame. If you’ve called a prospect more than once, it will be counted as one.
- Average calls per lead - The number of calls placed per lead over a specified time. This doesn’t include archived or skipped actions.
- Calls per agent - The number of calls placed by a single agent per hour. Call centers use automated dialing to avoid low calls per agent.
- Call volume - This is the total number of calls call center agents made to prospects in an hour, per day, or per week.
- Conversion Rate - The percentage of outbound calls that result in a sale or other desired outcome.
- Dialer Efficiency - The number of dials made per agent per hour and the caller's efficiency in terms of connection with prospects and the outcomes.
Advanced call center metrics
Here are some of the most intricate call center metrics.
Average Call Duration (ACD)
This is the average duration of calls in a specified period. You calculate it by dividing the total sum of seconds of calls your leads answered by the number of calls agents conducted.
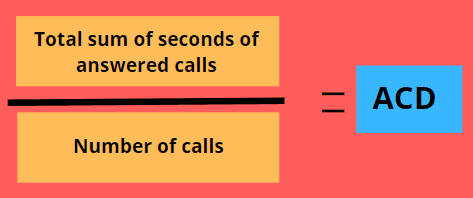
For example, if your call center agents spent five hours making 100 calls, here is how the ACD will be.
(5 x 60 x 60) / 100 calls
18000/100
ACD = 180
This metric is all about reputation and data quality. It's used by telephony providers to measure the quality of traffic, and they will flag customers with numbers under a certain threshold and even block them.
Answer Seizure Ratio (ASR)
ASR is the percentage of successfully connected calls compared to the number of attempted calls placed by agents.
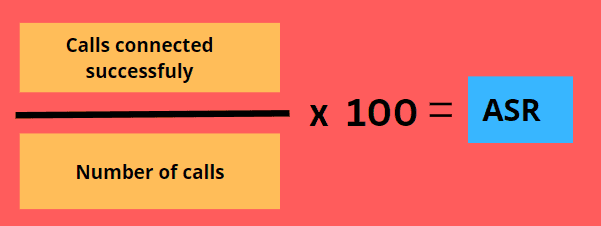
Connected calls refer to all the calls that customers answered, plus those that went into the customer’s voicemail.
A reasonable ASR rate should be around 40% - 60% if you want meaningful conversations that lead to conversions.
To increase your ASR, call prospects within business hours, use accurate call lists, avoid calling the same number multiple times, and allow the calls to go to voicemail.
Here’s an example you made a total of 250 calls but only made connections with 150 prospects.
150 x 100
250
ASR = 60%
Net Promoter Score (NPS)
NPS is a customer loyalty metric that tells how customers are satisfied with your product and if they are likely to promote it.
Getting data on your NPS is simple. Create a survey that asks customers this question, “on a scale of 1 -10, how are you likely to promote our product to friends and family members?”
To calculate NPS, first, get the percentage of the number of customers that gave you a score of 9 -10. These are known as promoters.
Then calculate the percentage of customers that gave you a score of less than 6. These are also called detractors. Once done, subtract the percentage of promoters and detractors.
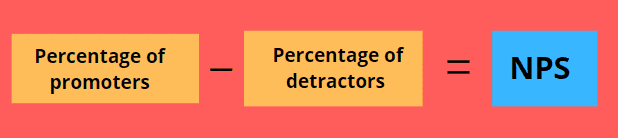
Here’s a worked-out example calculator.
Percentage of promoters = 70
Percentage of detractors = 20
(70 - 20 )
NPS = 50%
Average after-call work time
This is the time difference between agents performing after-call work (updating the system, scheduling follow-up actions, and recording the reason for contact) and making another call.
A long after-call work time means that your sales agents are less productive as they have less time on the call.
To lower the average after-call work time, give agents effective wrap-up templates. In addition, remove unnecessary wrap-up post-call formalities.
For example, let's say a call center made 100 calls in one day, and it took a total of 2,000 seconds for all tasks related to those calls to be completed after the calls ended.
Here’s what the calculation would look like.
2000
100
AAWT = 20 seconds
Contact Rate (CR)
This is the percentage of unique customers that answered your call compared to the total number of customers you called over a period.
A high contact rate means you talked with more prospects, indicating that you’re likely to close more leads. To improve contact rates, dedicate more time to get qualified leads, use local numbers and choose a robust sales dialer.
The contact rate is calculated by dividing successful conversations by the total number of calls made over a specified time frame.
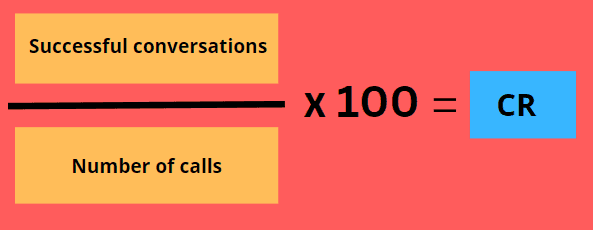
Below is an example calculation if you called 100 leads but only managed to speak to 70.
70 x 100
100
CR = 70%
Occupancy Rate (OR)
The occupancy rate in a call center measures how much time agents spend handling calls as a percentage of their total working hours.
It is calculated by dividing agents' time handling calls by the time they are available to work and expressing the result as a percentage.

For example, if an agent works 8 hours a day and spends 4 hours handling calls, their occupancy rate would be 50%.
The occupancy rate is an essential metric for call centers because it can help managers determine how effectively they utilize their agents' time.
A high occupancy rate indicates that the call center is efficiently handling calls and that agents are fully utilized.
A low occupancy rate, on the other hand, shows that agents are not being utilized effectively and that there may be opportunities to improve the efficiency of the call center.
Right Party Contact
Right party contact (RPC) is a metric that measures the percentage of calls made by a sales team that reach the intended recipient. In other words, it is the ratio of successful calls to the total number of calls made.
A high RPC rate is generally considered a good indicator of the effectiveness of a sales team, as it means that the team can reach the intended recipients of their calls and potentially make sales.
RPC is often used as a performance metric for sales teams, and companies may set targets for RPC to encourage their sales teams to make high-quality calls.
Cost per call (CPC)
Cost per call in a call center determines the total cost of running the call center divided by the number of calls handled. It is often used as a way to track the efficiency of the call center and to identify opportunities for cost savings.
To calculate the cost per call, you need to know the total operating costs of the call center. These include:
- Salaries and benefits for agents and managers.
- Rent and utilities
- Equipment and software costs
- Other expenses related to the operation of the call center.
Once done, divide this total cost by the number of calls handled over a given time, such as a month or a year.
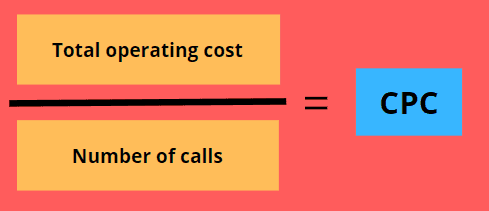
For example, if a call center's total operating costs for a year are $200,000 and it handles 50,000 calls in that year, this would be the cost. the cost per call would be $4.00
$200,000
50,000
CPC = $4
Average handle time (AHT)
Average handle time is the average time it takes for a call center agent to complete a call from start to finish.
This includes the time spent talking to the prospect and any additional time spent on hold or searching for information.
AHT is an important metric because it helps businesses understand how efficiently their reps handle calls and how long they spend on each call. To calculate AHT, divide the total handle time by the number of calls.
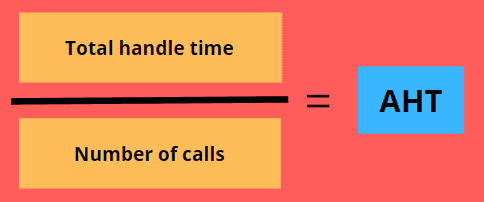
Here’s an example calculation if a call center made 200 calls and spent six hours.
6 x 60 x 60
200
AHT = 108 seconds
Final thoughts
Call centers aren’t just a way to converse with customers and solve their problems. The amount of data it receives can help you measure your performance and identify your agents' challenges.
So it’s up to you to figure out how to collect this data to boost the overall productivity of your agents. Luckily you already have a list of metrics you can start checking.
Written by
Jeppe Liisberg
Jeppe Liisberg is a forward-thinking entrepreneur and software developer who has built and contributed to multiple successful startups. With a philosophy centered on creating focused, specialized solutions that excel at solving specific challenges, Jeppe founded Myphoner after identifying a critical gap in the market for effective cold calling software.
"I believe that exceptional software should solve one core problem extraordinarily well rather than attempting to be everything for everyone," says Jeppe. "After years in the trenches as an entrepreneur, I couldn't find a cold calling solution that truly met the needs of small businesses and sales teams—so I built Myphoner to fill that void."
Today, Jeppe remains personally invested in Myphoner's success and customer satisfaction, personally welcoming new users and actively responding to feedback. This hands-on approach ensures that Myphoner continues to evolve based on real user needs while maintaining its commitment to simplicity, effectiveness, and affordability.
Connect with Jeppe on LinkedIn or reach out directly at jeppe@myphoner.com.
Related articles


Industry Related
Why Is It Important to Re-Engage with Old Leads and How to Do It Right
Take a shortcut to getting more business and lifelong fans with these easy steps to nurture your customer relationships.
October 11, 2022

Tools & Practices
Master Your Sales Follow-Up (with examples)
Your first cold call is important, but what's more important is the follow up, learn how to succeed by following up and achieve the sale.
October 5, 2022

Industry Related
How to Hire a Great Sales Development Representative (SDR)
Understand the role of a sales development representative (SDR) & what skills & attributes to look for when hiring one.
October 3, 2022